 EEA
EEASome remarks and tips on how to use and to get the most information out of Tableau viewers.
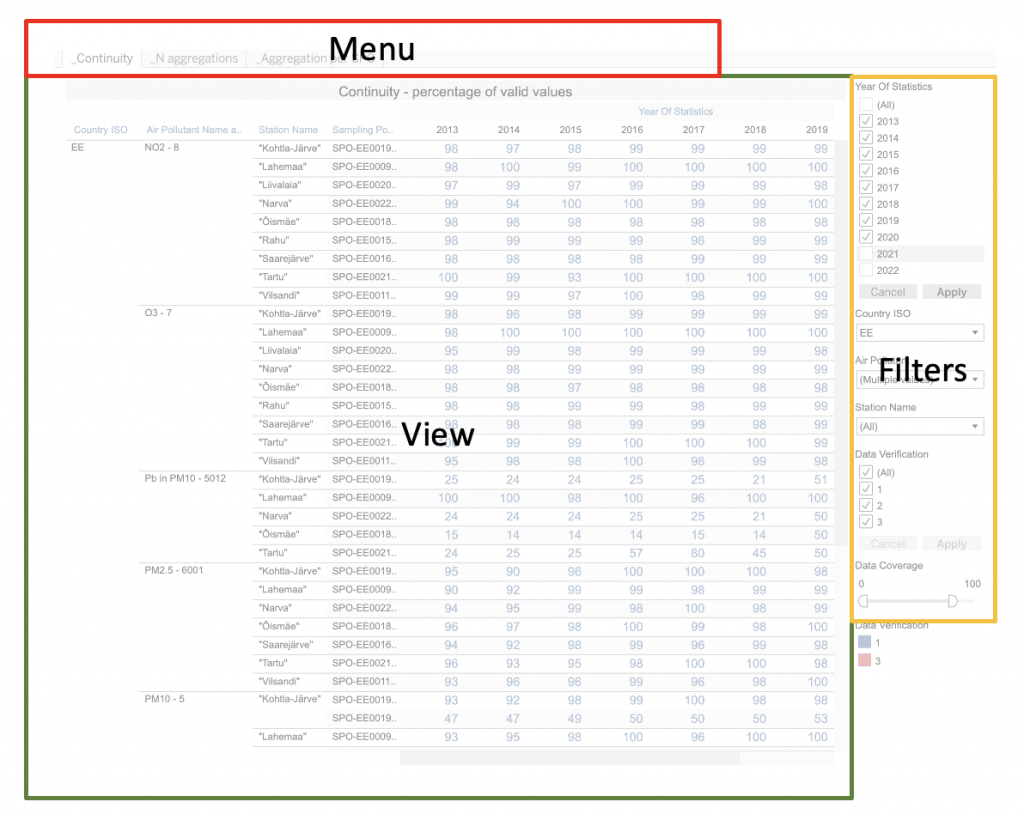
The typical layout of a Tableau viewer is usually composed of three sections:
- the ‘filter‘ section: allows you to select the data to be displayed according to your search criteria.
- the ‘menu‘ section: allows you to select the view you want to see for the data you have selected.
- the ‘view‘ section: displays the data you have selected according to the menu item you have chosen.
You can select the data you want to display by using the filters. For each filter, the possible values appear either directly or in a drop down box. There are two types of filter:
- those allowing to select only one value (‘single value’) and
- those allowing to select several values (‘multiple values’).
They are displayed either as a dropdown box (to be activated by clicking on the small arrow on the side of the input box) or as a list. In case of ‘multiple values’ filter, a box indicating “apply” might appears at the end of the dropdown or at the end of the list: the filter will be applied only when this “apply” box will be clicked.
All the filters are grouped in the filter section. This section is either directly displayed or can be displayed by clicking on the ‘funnel’ icon or by clicking on the button indicating “Filters” (acting as toggle on/off).
Important: it might happen that once all the filters are set, the ‘view’ section remains blank not showing any results. This is because there are no results corresponding to the combinaison of values selected in the filters or incoherent selection criteria (e.g. selecting a pollutant and selecting an aggregation which does not exist for that pollutant). However this might also happen in some extreme cases when different filters have been used several times consecutively: filters might be conflicting leading to an absence of results. In this case, the coherence of the values chosen for the different filters sould be verified. However, it is advised in a such a case to re-upload the viewer.
The menu allows to access different alternative views of the data set. There are two types of menu:
- tabs appearing in the upper part of the viewer window or
- buttons appearing in the viewer window.
The viewers are of three types:
- maps,
- graphs or
- tables.